
Fig. 3. Brain regions showing clusters of association between GM ADC and fibrinogen among overweight and obese individuals.
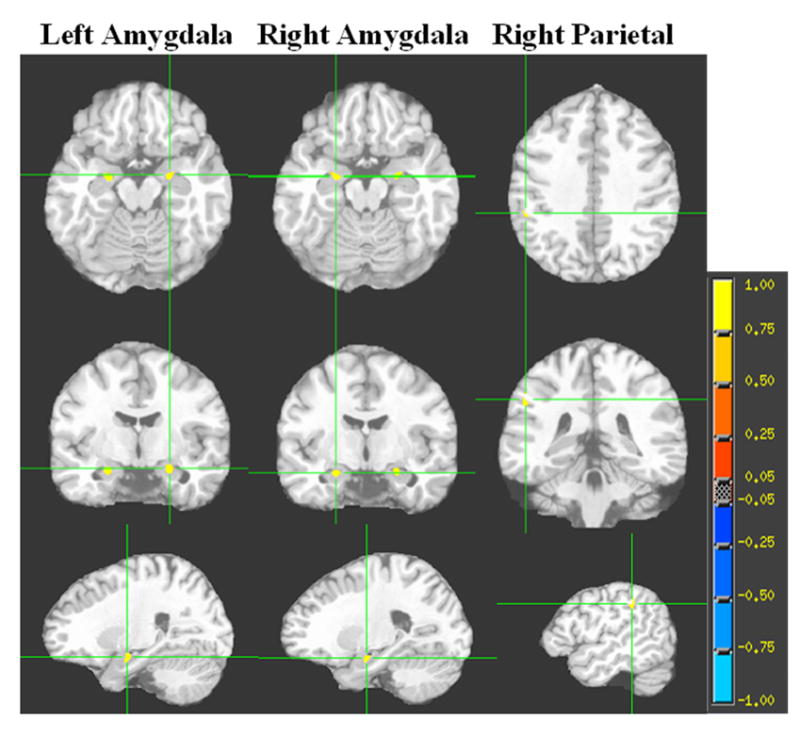
Each column represents the 3 orthogonal orientations (axial, coronal, sagittal) for the significant positive correlation clusters (analysis controlling for age; minimum cluster size 100 voxels; p<0.001) overlaid on the T1 target image. The color bar represents the strength of the correlation.