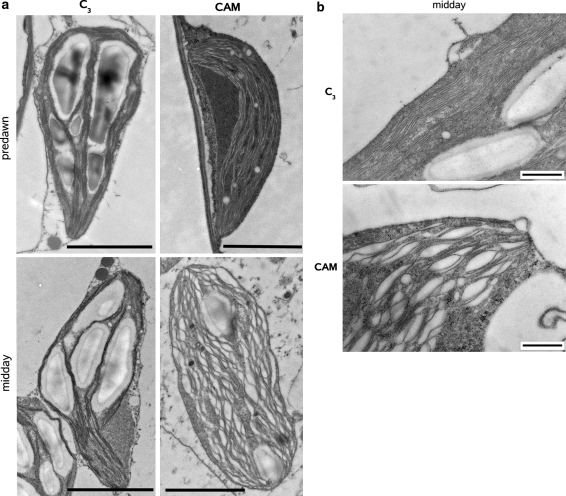
Fig. 4.
Electron micrographs of chloroplasts of M. crystallinum plants performing either C3 or CAM metabolism. Samples for analysis of chloroplast ultrastructure were taken at the end of the night (predawn) and at midday, respectively. The bar in the overview pictures (a) represents a distance of 2 µm. In panel b, the thylakoid membrane system at midday is shown at higher magnification. The bar on panels (b) represents a distance of 0.5 µm. The photos are typical examples of at least 26 repetitions

