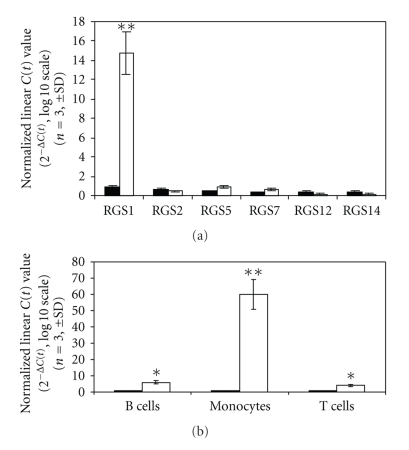
Figure 1.
RGS1 expression and cell-type specificity. PBMCs were stimulated with IFN-β (1000 IU/mL) for 4 hours (Figure 1(a)). RNA was isolated, and expression of different RGS family members was determined by RT-PCR as described in Section 2. Results are presented as linearized C(t) values (n = 3, ±SD) normalized to GAPDH. For comparison, samples having background expression were calibrated to 1.0 (black columns). RGS1 was clearly the most predominant RGS family member induced by IFN-β after 4 hours (white columns). Each RGS family member tested is shown on the x-axis. Figure 1(b) shows the IFN-β-dependent expression of RGS1 in three different primary cell populations (B cells, monocytes, T cells). Data are presented as nonlinearized C(t) values normalized to GAPDH (mean ± SD, n = 3). *P < .05,**P < .01.

