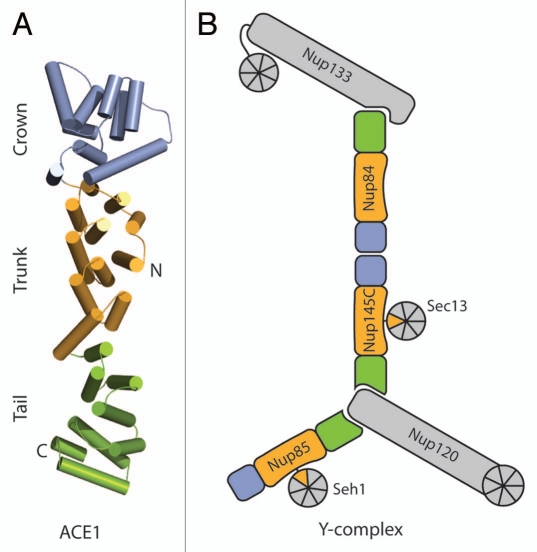
Figure 1.
Schematic of ACE1 and the Y-complex. (A) The three modules of the ACE1 domain—crown, trunk and tail—are shown in blue, orange and green, respectively. The positions of the N and C termini are indicated. (B) The relative positions of the nups within the Y complex are shown. ACE1 nups are colored as in (A), all others in gray.

