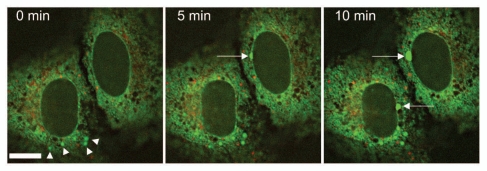
Figure 5.
Live cell imaging of U2OS cells 12 hours after cotransfection of mCherry-LBR (1–533) (red) and SP-GFP (green), a marker construct for the ER lumen and the PNS. Images were taken every 5 minutes, revealing the progressively dilating ER lumen (arrowheads) as well as the dilation of the PNS (arrows). Scale bar, 10 µm.

