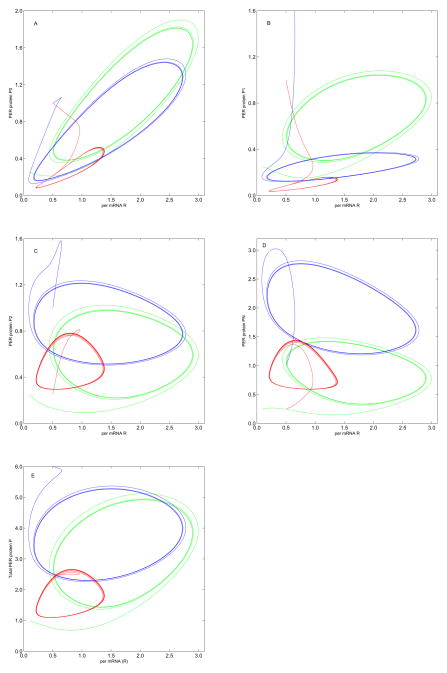
Figure 2.
Limit cycles generated by sustained oscillations of per mRNA R and PER protein P0 (A), P1 (B), P2 (C), PN (D), and the total amount of PER protein (E), respectively, for different QTL genotypes, AA in green, Aa in blue, and aa in red, according to ODE (1).

