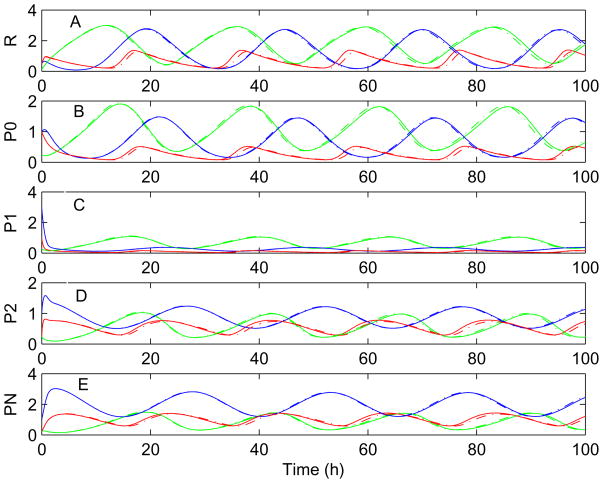
Figure 4.
True curves (solid) of different QTL genotypes, AA in green, Aa in blue, and aa in red, for the time evolution of per mRNA R (A), PER protein P0 (B), P1 (C), P2 (D), and PN (E), respectively, in a comparison with the corresponding curves (broken) estimated from 25 time points and 0.4 heritability.

