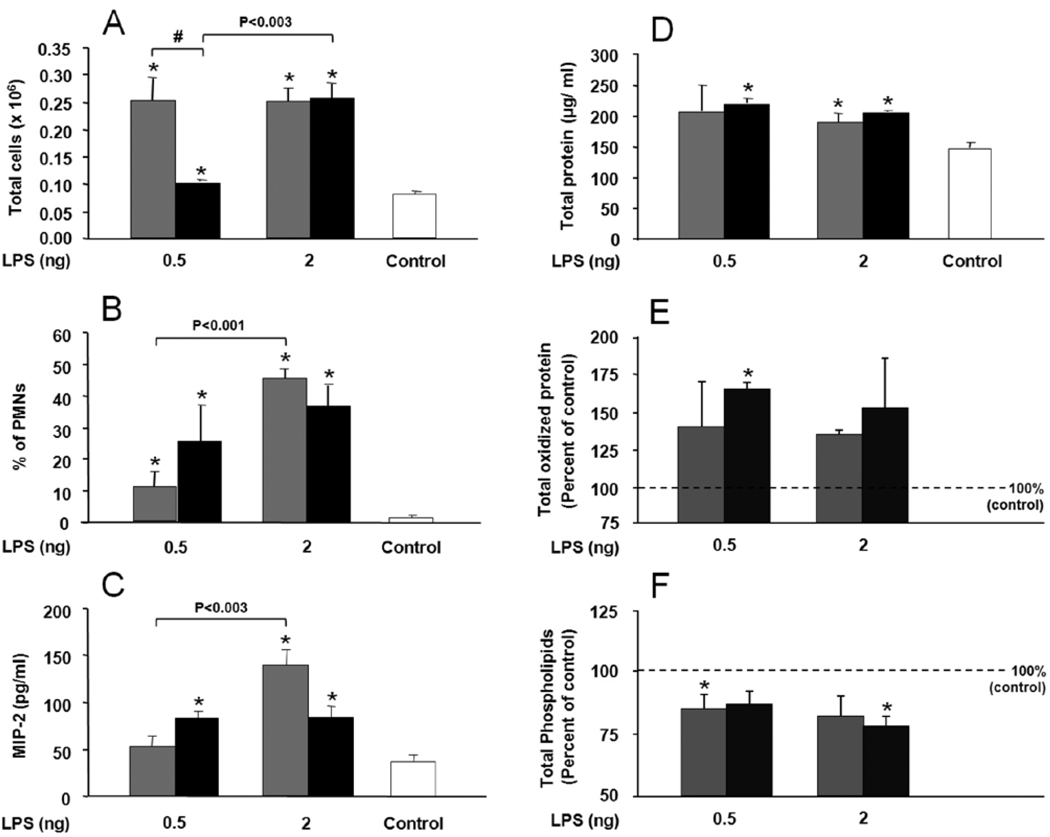
FIGURE 2.
Lipopolysaccharide (LPS) effect on total cell and polymorphonuclear leukocyte (PMN) count, macrophage inflammatory protein 2 (MIP-2) content, total protein and oxidized protein, and total phospholipids in bronchoalveolar lavage (BAL) of surfactant protein A deficient (SP-A −/−) mice (KO) in comparison with wild type (WT) mice. The mice received intrapharyngeal instillation of selected LPS doses (0.5 ng and 2 ng) in 50 µl saline. Control mice received 50 µl saline in parallel. BAL was collected 20 h after LPS treatment. Values are expressed as mean ± S.D. (n=4) for WT (gray bars), KO (black bars). Filtered air (FA) control values are represented by a single bar (open bar) when no differences were seen between KO and WT mice (panels A, B, C, D). For panels E and F, where differences in basal levels between WT and KO were observed, the control values were set to 100% (dotted line). Data are shown for total cells (A), percentage of PMNs (B), MIP-2 (C), total protein (D), total oxidized protein (E), and total phospholipids (F). Statistically significant (p ≤0.05) differences between LPS treated and control mice are indicated by an asterisk (*), and between WT and KO mice by the sign (#) above a connecting bar. Differences between LPS doses in WT or KO are shown by a connecting bar with the p-value above the bar.

