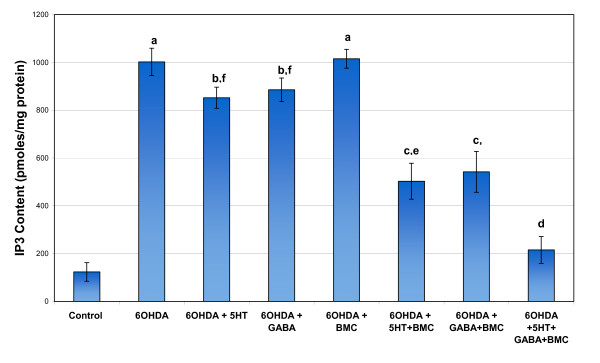
Figure 3.
Representative graph showing IP3 content in the cerebral cortex of experimental rats. Values are Mean ± S.E.M. of 4-6 separate experiments. Each group consists of 6-8 rats. a p < 0.001, b p < 0.01, c P < 0.05 when compared to Control, d p < 0.001, e p < 0.01, f P < 0.05 when compared to 6-OHDA group. C - Control, 6-OHDA - 6-OHDA infused, 6-OHDA +5-HT - 6-OHDA infused treated with Serotonin, 6-OHDA +GABA - 6-OHDA infused treated with GABA, 6-OHDA +BMC- 6-OHDA infused treated with BMC, 6-OHDA +5-HT+BMC- 6-OHDA infused treated with Serotonin and BMC, 6-OHDA + GABA +BMC- 6-OHDA infused treated with GABA and BMC, 6-OHDA +5-HT + GABA+ BMC- 6-OHDA infused treated with Serotonin, GABA and BMC.

