
Figure 9.
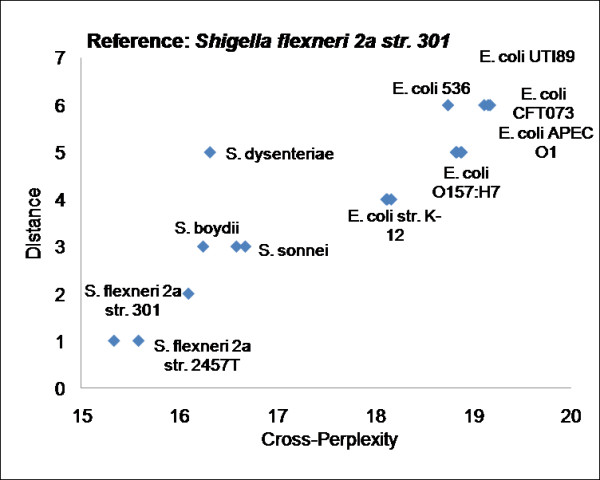
Cross-perplexity versus branching distance in evolutionary tree within the same or related genus. Figure shows the cross-perplexity values of organisms that belong to Shigellae and E. coli genera versus their branching distance in the evolutionary tree [44]. S. flexneri 2a str. 301 was used as the reference organism and a language model of 4-grams was trained.