
Figure 7.
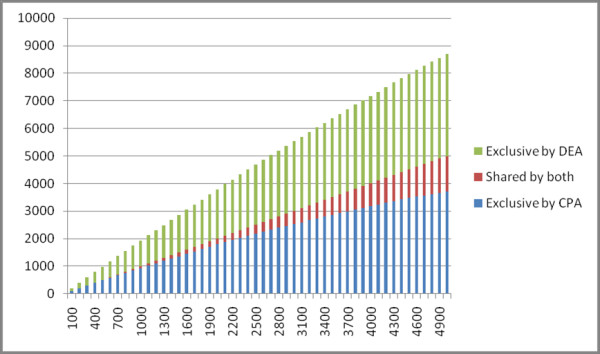
Comparison of Differential Expression Analysis (DEA) and Change Point Analysis (CPA) in Prediction of miRNA-155 Targets. (a). The horizontal axis represents gene cut-off's while the vertical axis represents the number of genes called by DEA, CPA or both. (b). Validation analysis of the prediction results in (a) against the set of 170 genes where the in vitro 3'-UTR assays were performed. (c). Examples of predicted targets with detected change points in the 3'-UTR end.