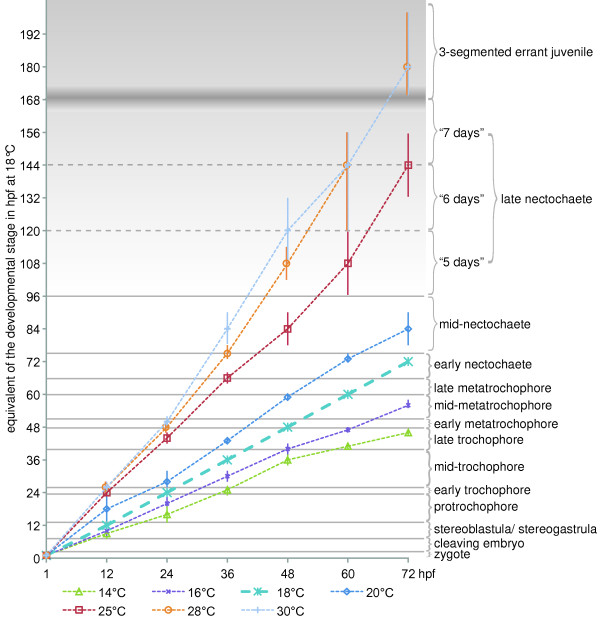
Figure 29.
Influence of temperature on developmental speed in P. dumerilii. Diagram, which shows the developmental stage reach 12 h, 24 h, 36 h, 48 h, 60 h and 72 h post fertilization, growing at 14°C, 16°C, 18°C, 20°C, 25°C, 28°C and 30°C. Sampling was performed every 12 h for 72 h. The error bars indicate the range within the stage, at which the embryos or larvae were found. Within this range it was not possible to determine the stage more precisely. The gradient in the chart background indicates the decreasing synchrony from the late nectochaete stage onwards. The transversal lines indicate the end of one stage and the beginning of the following one, The duration of the late nectochaete stage and the beginning of the following stage vary, indicated by the bold blurred line.

