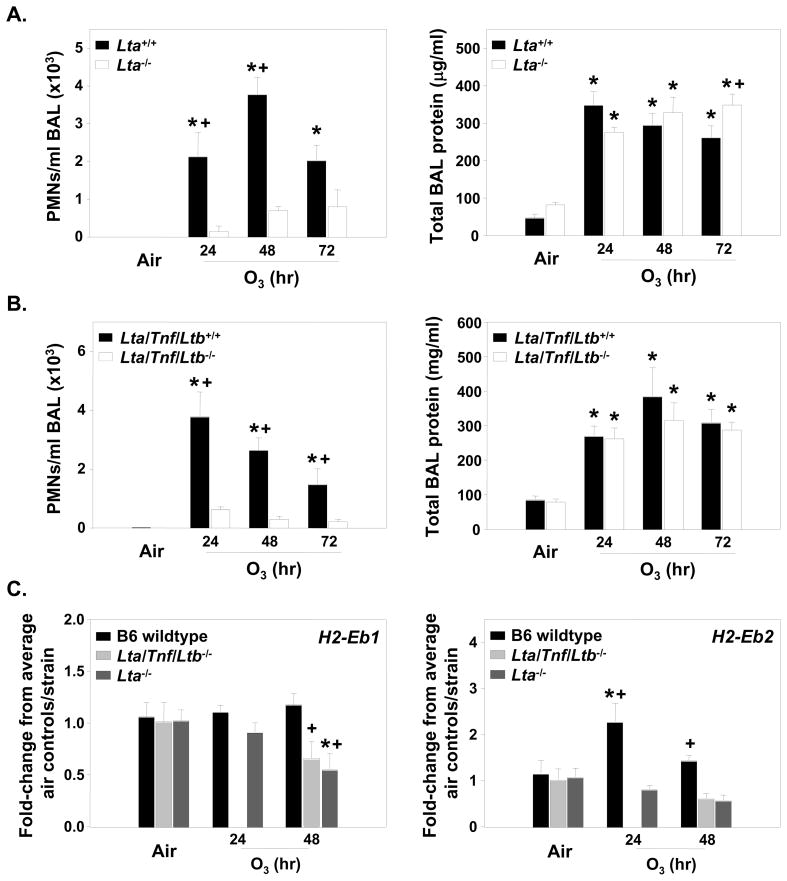
Figure 6. O3-induced responses in mice deficient in Lta or the Tnf cluster (Lta, Tnf, Ltb) genes.
A) BALF PMNs and total protein for mice deficient in Lta and their wildtype controls. Data are presented as means ± SEM (n=3–10 per experimental group). *, Significantly different from air exposed mice (P < 0.05). +, Significantly different from Lta+/+ mice (P < 0.05). B. BALF inflammatory parameters for the Lta/Tnf/Ltb deficient mice in response to O3 compared to wildtype mice. Data are presented as means ± SEM (n=3–10 per experimental group). *, Significantly different from air exposed mice (P < 0.05). +, Significantly different from Lta/Tnf/Ltb+/+ mice (P < 0.05). C) Gene expression for the MHC class II genes (H2-Eb1 and H2-Eb2) in the mice deficient in either Lta or Lta/Tnf/Ltb compared to the wildtype mice. B6 are the wildtype for both strains and the numbers were combined since they were not significantly different from one another. No 24 h samples for Lta/Tnf/Ltb−/− mice were done for gene expression analysis. Data are presented as means ± SEM (n=3–6 per experimental group) and were determined using the comparative CT method (see Supplemental Materials and Methods section). Y-axis represents either H2-Eb1 or H2-Eb2 normalized first to 18S followed by determination of the fold-change relative to the average air control value for each strain. *, Significantly different from air exposed mice (P < 0.05). +, Significantly different from wildtype mice (P < 0.05).

