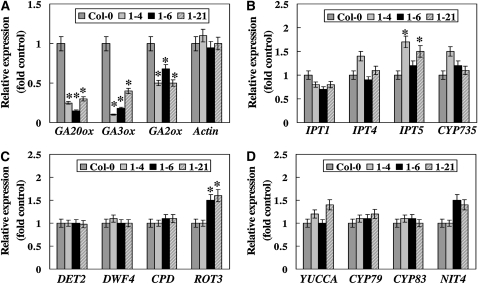
Figure 7.
Expression Levels of the Genes Involved in Hormone Metabolism in U11/U12-31K Knockdown Plants.
Values are means ± sd (n = 5). Asterisks above the columns indicate values that are significantly different from control Columbia-0 values (P ≤ 0.05).
(A) Expression of GA metabolism-related genes in the meristematic region only.
(B) Expression of cytokinin metabolism-related genes in the meristematic region only.
(C) Expression of BR metabolism-related genes in meristematic region only.
(D) Expression of auxin metabolism-related genes in meristematic region only.

