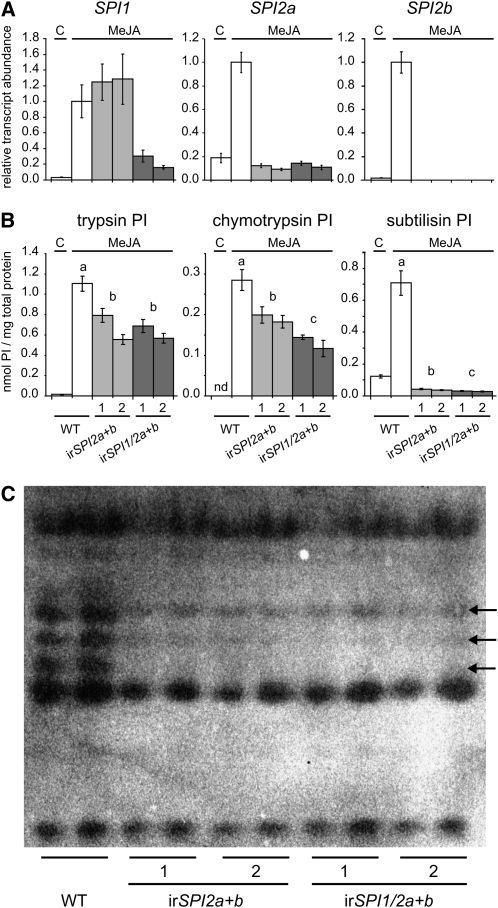
Figure 2.
Silencing Efficiency and Remaining SPI Activity in Plants Silenced in the Expression of SPI1, SPI2a, and SPI2b.
(A) Mean ± se relative transcript abundance of SPI1, SPI2a, and SPI2b in leaves of wild-type plants and of transgenic lines expressing an ir-construct specific for SPI2a and SPI2b (irSPI2a+b) or a construct specific for SPI1, SPI2a, and SPI2b (irSPI1/2a+b) (n = 7). C, control; MeJA, MeJA treatment for 24 h.
(B) Mean ± se inhibitory activity against trypsin, chymotrypsin, and subtilisin in leaves of wild-type (WT) plants and of SPI-silenced lines (C, control; MeJA, MeJA treated for 3 d). Different letters indicate a significant difference (nested ANOVA, lines nested within genotypes, TPI: F2,30 = 21.95, P < 0.001, ChyPI: F2,29 = 21.42, P < 0.001, SubPI: F2,30 = 349.82 P < 0.001, followed by a Scheffé post-hoc test, P < 0.05; wild-type control plants were excluded from the analysis).
(C) Profiles of active TPI proteins present in MeJA-induced leaves of wild-type and SPI-silenced plants, visualized with GXCP after 12% native PAGE. Each genotype is represented by two pools of two biological replicates. Arrows indicate bands missing in SPI-silenced lines.

