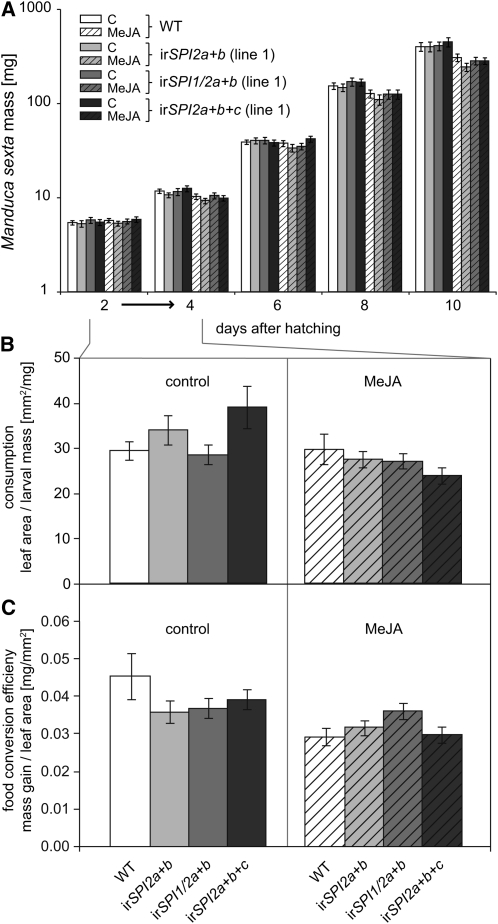
Figure 7.
Performance of M. sexta Feeding on Excised Leaf Discs from Wild-Type Plants and from Three Independently Stably Transformed Lines Silenced for Different Combinations of SPI1, SPI2a, SPI2b, and SPI2c.
The plants were either control treated (open bars) or induced with MeJA (hatched bars).
(A) Mean ± se larval mass over time (n = 30). A repeated measures ANOVA of larval mass over all days with genotype and treatment as factors revealed day, day × treatment (within subjects), and treatment (between subjects) as significant effects (see Supplemental Table 1 online). WT, wild type.
(B) Mean ± se leaf consumption by M. sexta, measured as leaf area relative to larval mass before the feeding period of 48 h from days 2 to 4. An ANOVA model with genotype and treatment as factors indicated a clear treatment effect but no genotype or interaction effect (genotype: F3,186 = 0.169, P = 0.917; treatment: F1, 186 = 9.621, P = 0.002; genotype × treatment: F3,186 = 2.538, P = 0.058).
(C) Mean ± se food conversion efficiency of M. sexta, measured as mass gain relative to consumed leaf area during 48 h from days 2 to 4. An ANOVA, similar to the one in (B), indicates an effect of treatment but no genotype or interaction effect (genotype: F3,182 = 0.554, P = 0.646; treatment: F1,182 = 7.591, P = 0.006; genotype × treatment: F3,186 = 2.294, P = 0.079).

