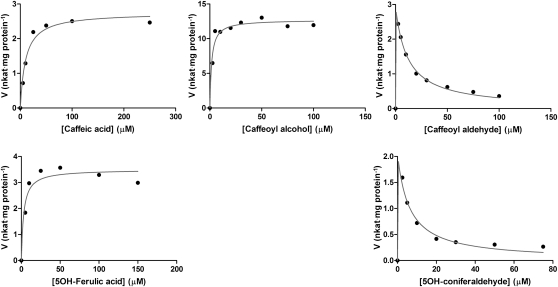
Figure 2.
Enzyme-Kinetics Analyses of Lp OMT1 with Various Monolignol-Precursor Substrates.
In each panel, initial reaction velocity (nkat·mg protein−1) is plotted against substrate concentration (μM), and the displayed curve is derived from nonlinear regression analysis (Prism). The results shown are from a single set of measurements for each substrate.

