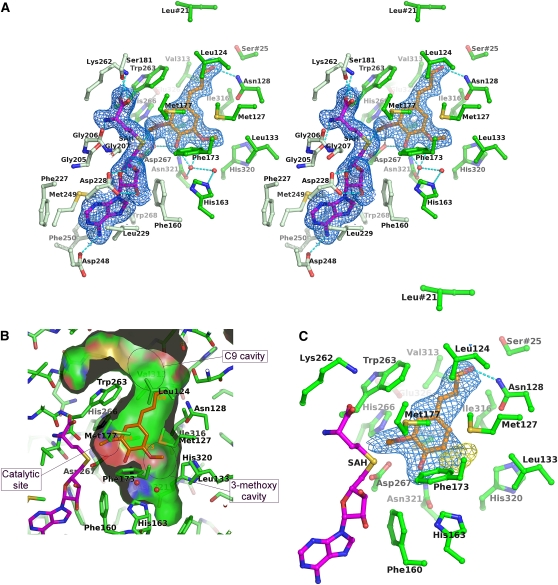
Figure 5.
Substrate and Product Binding Sites of Lp OMT1.
(A) OMT1 amino acid residues that interact with the SAH and sinapaldehyde products (divergent stereoview). The residues that interact with SAH (magenta carbon atoms) are colored light green, whereas those that interact with sinapaldehyde (orange carbon atoms) are colored dark green (only the α-carbon and side chain atoms of each residue are shown, except for the backbone segment Gly205-Gly206-Gly207). Water molecules are represented as small red spheres. Hydrogen bond interactions are shown as cyan dashed lines; those critical to the catalytic reaction (involving His-266, Asp-267, and Glu-326) are shown in dark gray. The substrate binding pocket is capped by the residues Leu-21 and Ser-25, which are contributed by the opposing monomer of the OMT1 homodimer. The blue-colored envelopes surround regions greater than +2.5σ in the omit Fobs-Fcalc electron density map. The atomic model and electron density are shown for the active site of monomer A (primarily, with small contributions from monomer B) of the crystallographic asymmetric unit; the active sites of the other three monomers are essentially indistinguishable.
(B) Surface of the binding pocket for phenolic substrate in the closed conformational state of OMT1. The depicted surface defines the area accessible to a probe sphere with a radius of 1.4 Å. The side of the surface that faces the phenolic substrate binding site is colored according to the identity of the bounding protein atom (carbon, green; nitrogen, blue; oxygen, red; and sulfur, gold); the reverse side of the surface is distinguished by gray coloring. For clarity, the front portion of the surface of the binding pocket has been removed. The positions of bound sinapaldehyde (orange) and two water molecules (red spheres) involved in interactions with the 3-methoxy and 4-hydroxyl groups are shown. The locations of cavities for the 3-methoxy and C9 substituents and the catalytic site are indicated.
(C) Binding of coniferaldehyde by OMT1. OMT1 active-site residues, SAH, and coniferaldehyde are displayed as in (A). The blue-colored envelopes surround regions greater than +1.0 σ in the initial 2Fobs-Fcalc electron density map (calculated prior to inclusion of coniferaldehyde in the atomic model). The yellow-colored envelopes surround regions greater than +2.5σ in the final Fobs-Fcalc electron density map. The difference density lobe indicates a significant fraction of coniferaldehyde molecules are bound with an alternative orientation of the phenyl ring, which transplaces the 3-methoxy group into the OMT1 3-methoxy cavity (as opposed to the catalytic site).

