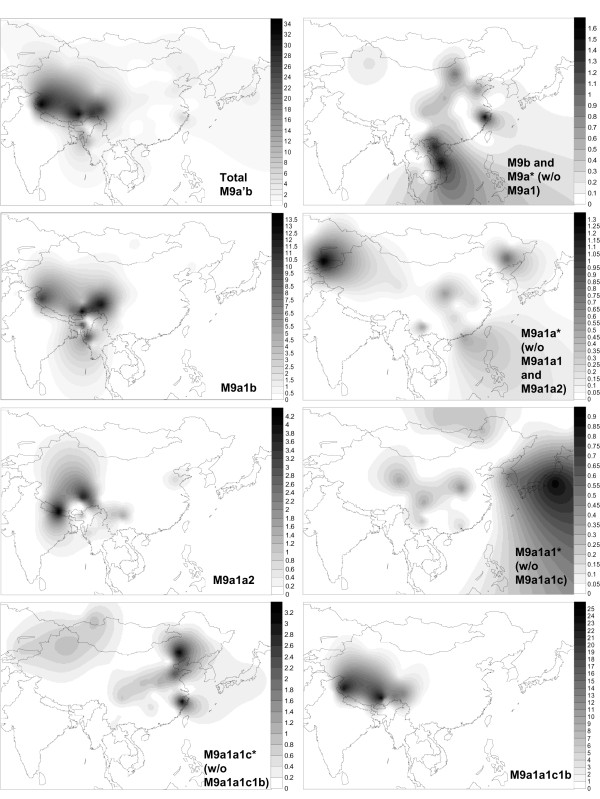
Figure 4.
Spatial frequency distributions of haplogroup M9a'b and its sub-haplogroups. Populations and corresponding frequency values are listed in Additional file 2. Fifty mtDNAs were not included in computing the population frequency because the essential information was missing or not reported in the original studies (see Additional file 1). The spatial-frequency distributions were created using the Kriging algorithm of the Surfer 8.0 package.

