Figure 1.
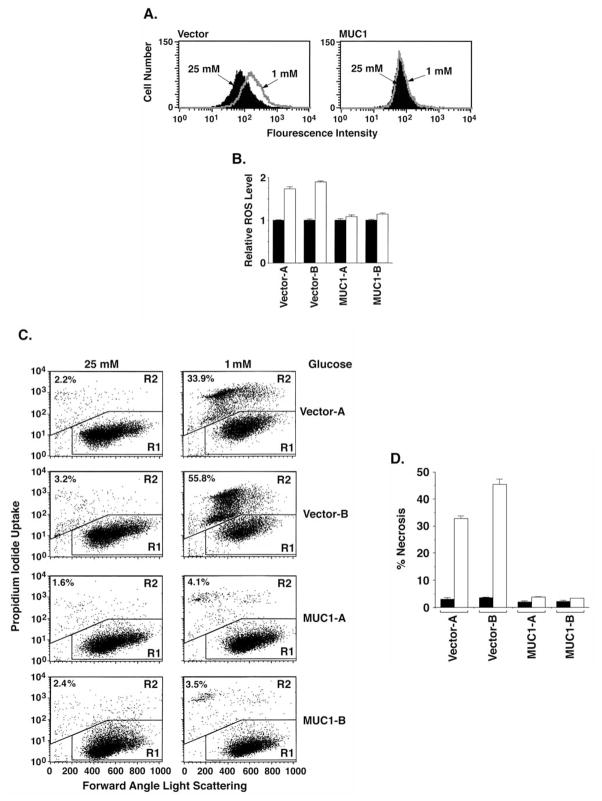
MUC1 blocks increases in ROS and necrosis of HCT116 cells in response to glucose deprivation. (A) HCT116/vector and HCT116/MUC1 cells were cultured in 25 or 1 mM glucose for 24 h. The cells were incubated with DCFH-DA for 20 min. Fluorescence of oxidized DCF was measured by flow cytometry. (B) The results are expressed as the relative ROS level (mean ± SD of three separate experiments) for cells in 1 mM glucose (open bars) compared to that in 25 mM glucose (solid bars). (C) HCT116/vector (clones A and B) and HCT116/MUC1 (clones A and B) cells were cultured in 25 or 1 mM glucose for 24 h. The cells were stained with PI and analyzed by flow cytometry. (D) The results are expressed as the percentage (mean ± SD of three separate experiments) necrotic cells for 25 mM (solid bars) or 1 mM (open bars) glucose.

