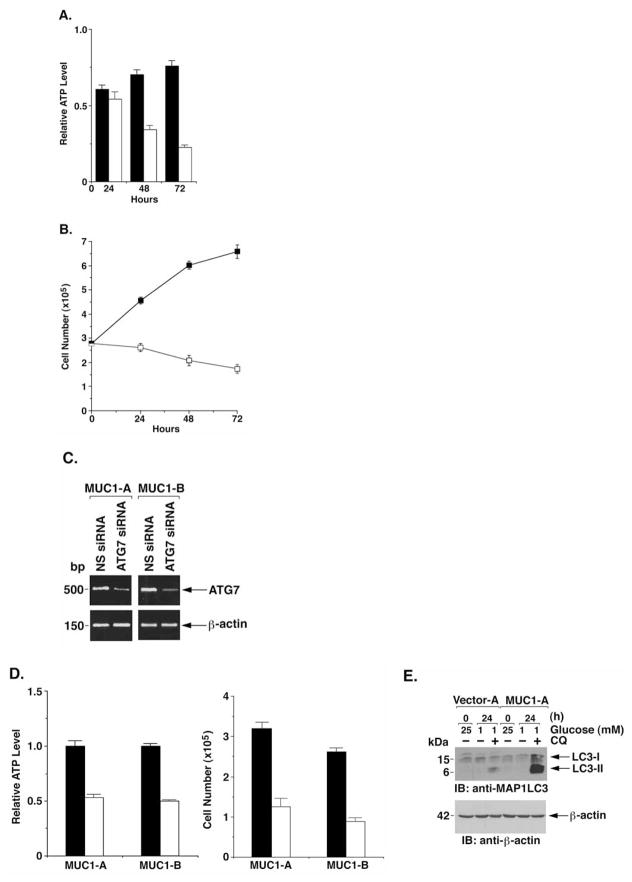
Figure 4.
MUC1 promotes autophagy in the response to glucose deprivation. (A and B) HCT116/MUC1 cells were cultured in 1 mM glucose and the absence (solid bars and squares) or presence (open bars and squares) of 10 mM 3-MA for 0–72 h. Intracellular ATP levels are expressed as mean ± SD of three separate experiments relative to that at 0 h (A). Cell number as assessed by trypan blue staining is expressed as the mean ± SD of three separate experiments (B). (C and D) HCT116/MUC1 cells were transfected with a non-specific (NS) siRNA or ATG7 siRNA for 5 days. Total cellular RNA was amplified with ATG7- and β-actin-specific primers (C). Intracellular ATP levels for ATG7 siRNA transfected cells (open bars) relative to that obtained with the NS siRNA transfected cells (solid bars) are expressed as mean ± SD of three separate experiments (D, left). Numbers of NS siRNA (solid bars) and ATG7 siRNA (open bars) transfected cells as assessed by trypan-blue staining is expressed as the mean ± SD of three separate experiments (D, right). (E) HCT116/vector and HCT116/MUC1 cells were cultured in 1 mM glucose for 24 h in the absence and presence of 50 μM CQ for the last 10 h. Lysates were immunoblotted with the indicated antibodies.

