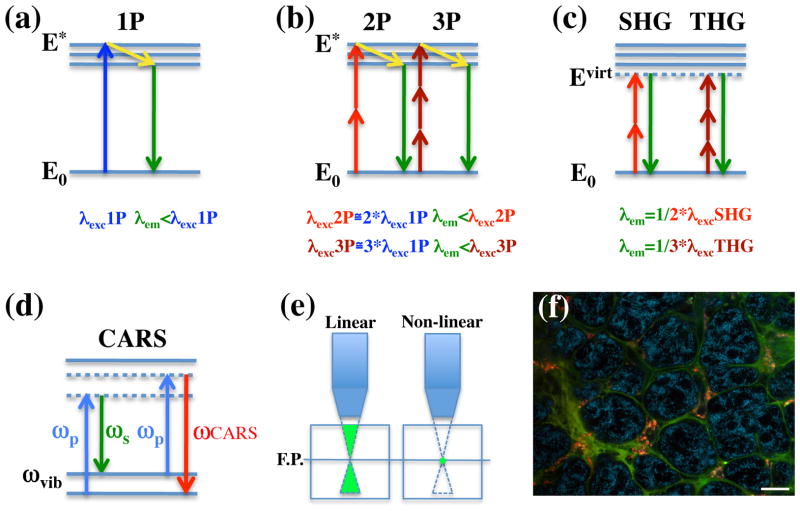
Figure 1. Non linear optical microscopy.
a–d Jablonski diagram illustrating (a) single photon (1P), (b) two-photon (2P) and three-photon (3P) excitation, (c) second (SHG) and third (THG) harmonic generation, and, (d) Coherent Anti-Stokes Raman Spectroscopy (CARS). a,b - In both single and MP microscopy, the emitted photons have a lower energy than the sum of the incident ones, due to some energy loss (yellow arrow). c – In SHG and THG the incident photons are scattered and recombine in a single one, without energy loss. d- In CARS microscopy two beams are used: the pump (ωp) and the stokes (ωs). When they are tuned to match a vibrational energy gap (ωvib), a strong anti-stokes signal is generated (ωCARS). Note that both in the harmonic emission and in CARS no electronic transitions occur. e) Non-linear emission occurs at the focal spot. f) Multiple fluorophores can be imaged using a single excitation wavelength. Alexa 488-dextran transferrin (green) and Texas Red–dextran (red) were injected in the submandibular glands of male rats and internalized into endosomal vesicles by fibroblast located in the stroma. After 1 hour, the glands were imaged by MPM using 750 nm as excitation wavelength. The endogenous fluorescence highlights the acinar structures (cyan). Note that both transferrin and dextran bind to the extracellular matrix surrounding the acini. Scale bar - 20 μm

