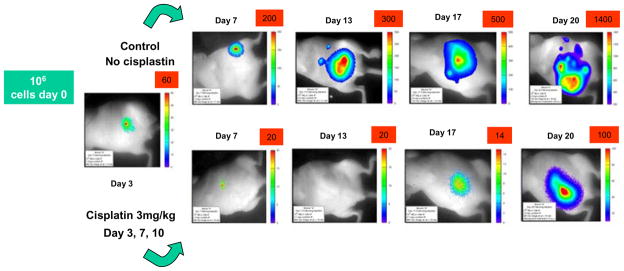
Figure 2. Assessing chemotherapy by BLI.
Series of images of two nude mice imaged at various times after injecting HeLa-luc cells into the peritoneum. On each occasion mice were anesthetized and 150 mg/kg luciferin was administered followed by a 10 min. image. The upper mouse served as control, while the lower series of images show a mouse which received cis-platinum chemotherapy at 3 mg/kg on days 3, 7 and 10 following introduction of tumor cells. Note images have been scaled differently to accommodate the massive changes in dynamic range.

