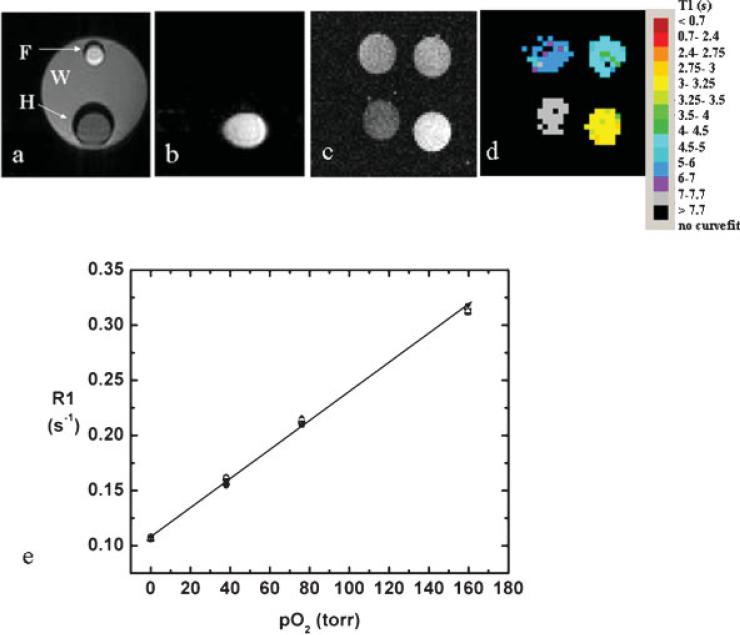
Figure 2.
Water and fat suppression. (a) T1-weighted spin-echo image of phantom with smaller tubes containing mineral oil (F) and HMDSO (H) inside a tube containing water (W), and (b) EPI image of the same phantom with fat and water suppression. (c) T1-weighted spin-echo image and (d) T1 maps of a phantom comprising HMDSO saturated with gases at different concentrations of oxygen (clockwise from bottom left: 0%, 5%, 10% and 21%) obtained using PISTOL. (e) A linear fit to the data (mean region of interest intensities, six measurements) yields the calibration curve: R1 = (0.108 ± 0.001) + (0.00130 0.001) × pO2 at 36.5°C.

