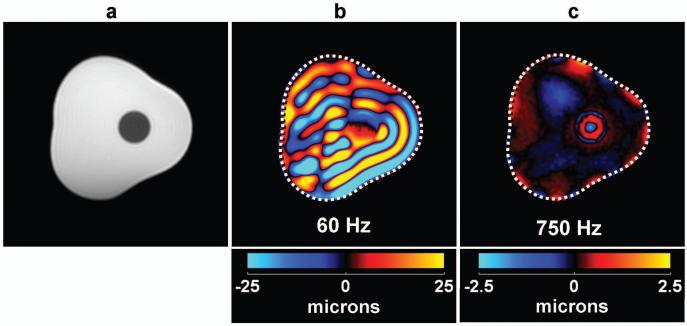
Figure 4.
(a) A conventional MR magnitude image of a cross section of the inclusion phantom showing the location of the inclusion as the hypointense region near the middle of the image. (b) A single wave image of the shear waves produced from 60-Hz longitudinal vibrations in the direction perpendicular to the imaging plane. (c) A single wave image due to 750-Hz longitudinal vibrations with the inclusion now clearly distinguishable from the background gel.

