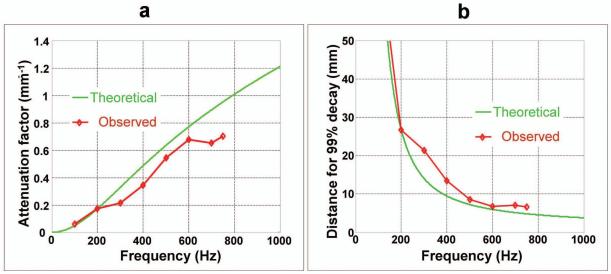
Figure 7.
(a) A graphical comparison of the theoretical (without marker) and the observed (with marker) attenuation factors for the B-gel in the inclusion phantom at various frequencies. (b) A comparison of the distance required for 99% decay of the wave amplitude for the theoretical model and the experimental observations. The measured data agree well with the theoretical model.

