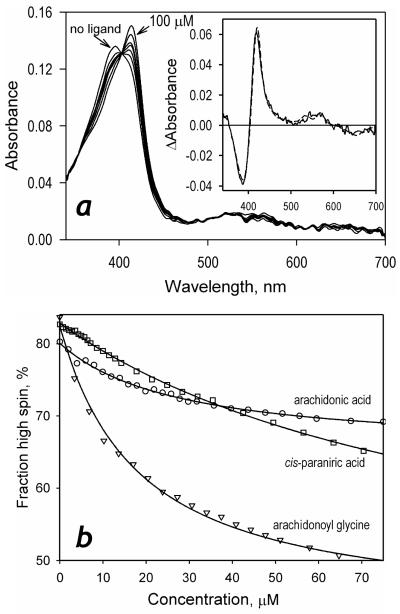
Figure 4.
Interactions of P450-SS9 with unsaturated fatty acids and arachidonoyl glycine. A series of absorbance spectra obtained in a titration of 1.8 μM P450-SS9 with arachidonoyl glycine is shown in panel a. The inset shows the spectrum of the first principal component of the observed changes (insert) along with its approximation with the prototypic spectra of high-to-low spin transitions in P450BM-3 (dashed line). Panel b represents the titration curves of 0.8-1.8 μM P450-SS9 with a series of saturated fatty acids along with their approximations using the equation for the equilibrium of binary association.

