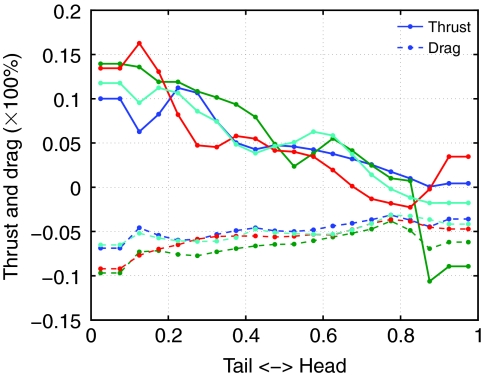
Fig. 11.
Hydrodynamic thrust and drag generated along the body over one swim cycle, normalized by the total thrust. The abscissa indicates the location along the body; 0 is the tail tip and 1 is the head tip. The colored curves (as in Fig. 13B) represent four swimming episodes (1, 2-1, 3-1 and 4). Thrust and drag are defined as projections of the normal and tangential forces onto the x-axis, averaged over one cycle. Negative drag indicates that the drag is in the direction opposite to the swim direction (the leeches swim toward the positive x-axis). The length of the head and tail links are twice as long as the middle links, and hence the force on each of these links is divided in two and is plotted as two data points. The thrust increases roughly linearly toward the tail; the drag is nearly constant.

