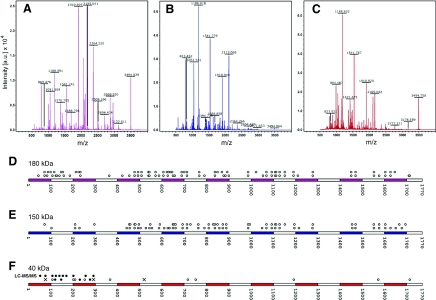
Fig. 2.
Mass-spectrometry identification of vitellogenin-derived peptides from the 180 kDa, 150 kDa and 40 kDa SDS-PAGE bands. Representative spectra of the 180 kDa (A), 150 kDa (B) and 40 kDa (C) vitellogenin bands. Selected peaks denoted by their mass/charge ratio are indicated in the figure panels. (D-F) Mapping of the peptides onto the vitellogenin primary sequence identifies which regions of vitellogenin can be assigned to each fragment. Each circle above a sequence denotes a peptide matching vitellogenin fragment that can be found in this position along the primary sequence. In D and E, the two rows of circles above sequences are independent repeats of a MALDI-TOF experiment on 180 and 150 kDa vitellogenin, respectively. (F) Vitellogenin peptide matches, 40 kDa gel band. LC-MS/MS peptide hits on the first lane indicated with black circles. MALDI-TOF peptide hits on the second lane are marked by seven peptides that were either confirmed (black circle) or not supported (crosses) by fragmentation analysis.

