Fig. 1.
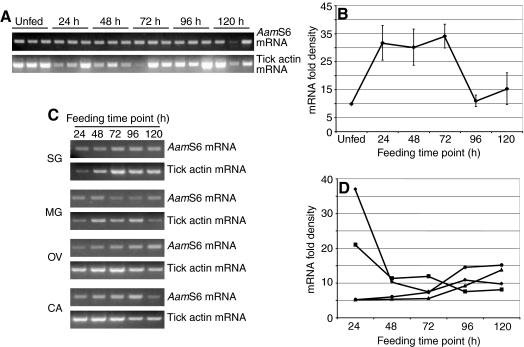
Temporal and spatial RT-PCR expression analyses. Total RNA extracted from (A) three whole ticks per feeding time point (unfed, 24, 48, 72, 96 and 120 h), and from (C) dissected tick organs [salivary glands (SG), midgut (MG), ovary (OV) and carcass (CA, tick remnant after removal of SG, MG and OV)] pooled from eight ticks were subjected to titration two-step semi-quantitative RT-PCR to amplify the AamS6 fragment and tick actin (sample load control). Densities of AamS6 PCR bands in whole ticks (B) and dissected tick organs (D) were determined and normalized against tick actin, as described in the Materials and methods. For whole ticks (B), means and standard error of the means (s.e.m.) of the three PCR band densities per time point were calculated using the graph pad calculator (http://www.graphpad.com/quickcalcs/ttest1.cfm). In D, the filled circle denotes midgut, filled diamond denotes salivary glands, filled triangle denotes carcass and filled square denotes ovary.

