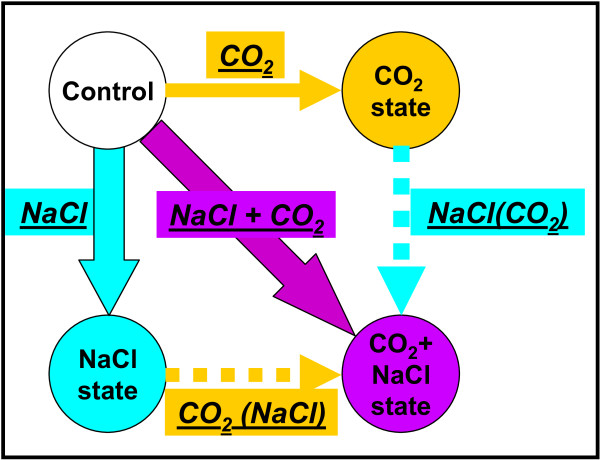
Figure 1.
Simple schematic of the experimental design. Each arrow depicts the stress that is imposed on the physiological state at the start end of the arrow to reach the physiological state at the end point of the arrow. The nodes of the graph depict the physiological states as they were monitored by the four monitored A. thaliana liquid hydroponic culture sets. Based on the particular experimental design, the effect of two perturbations that were not applied experimentally could be implied from the data: 1) the NaCl stress on the under the elevated CO2 conditions physiological state (depicted as NaCl(CO2) stress), and 2) the elevated CO2 conditions on the under the NaCl stress physiological state (depicted as CO2(NaCl)).

