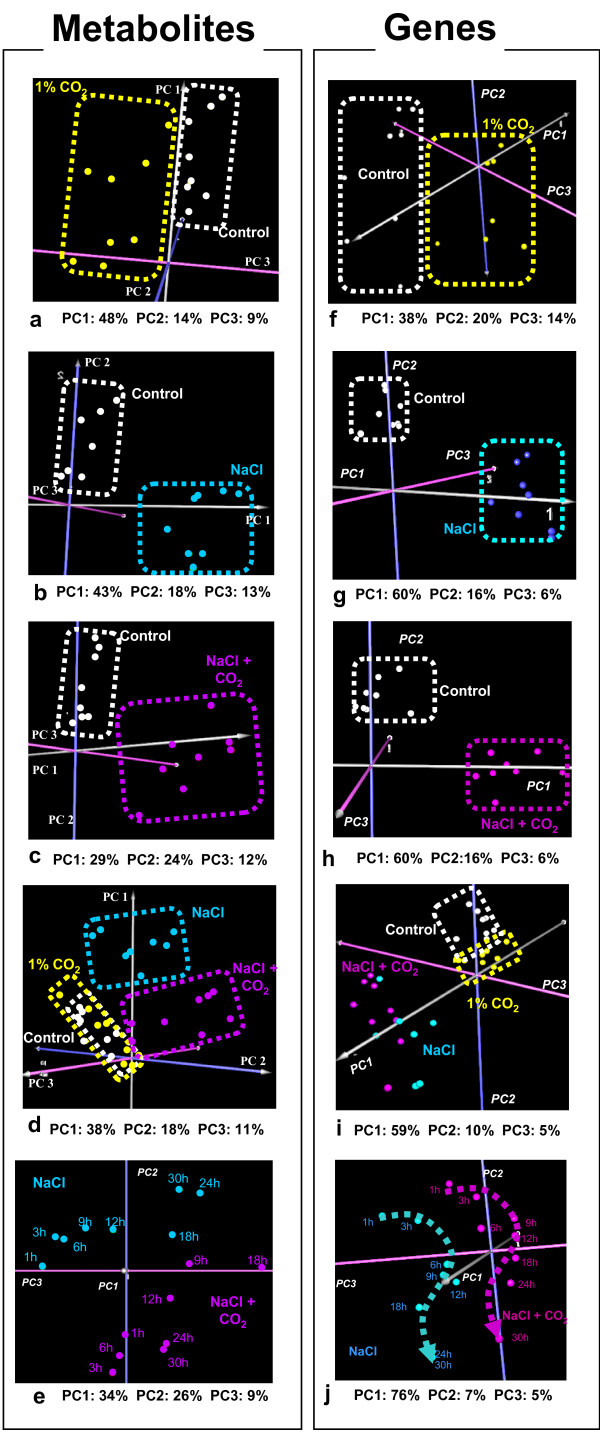
Figure 2.
Principal component analysis (PCA) of the metabolomic (a-e) and transcriptomic (f-j) datasets. A spot in any of the (a-e) and (f-j) graphs represents, respectively, the metabolic or the transcriptional profile of the plant cultures at one of the experimental timepoints under the stress conditions, the name of which is depicted in the same color.

