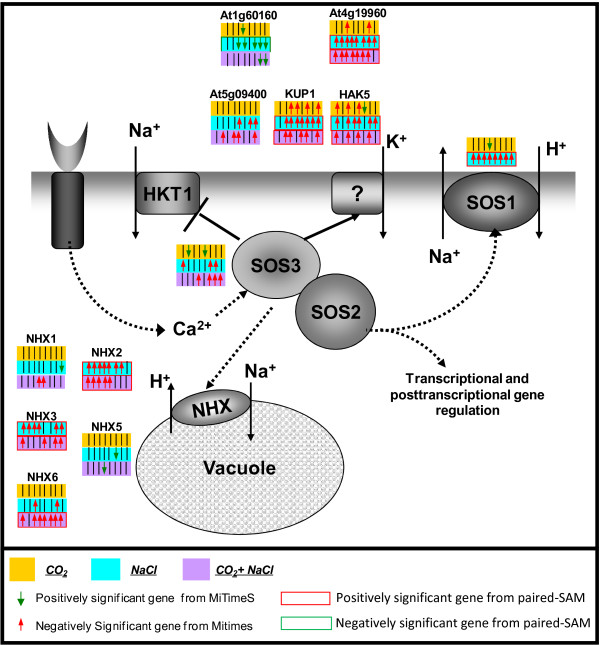
Figure 4.
The significance profile over time and the significance level by paired-SAM of genes in the SOS pathway due to (a) the elevated CO2 perturbation (yellow background), (b) the NaCl stress (light blue background) and c) the combined stress (purple background) on the control state. If a gene was identified as positively, negatively or nonsignificant at the n-th time point for a particular stress, then the n-th short arrow in the box corresponding to the color assigned to the particular stress next to the reaction catalyzed by the protein encoded by the particular gene is upward and colored red, downward and colored green or a black short line, respectively. If the gene was also identified as positively or negatively significant over all time points by paired SAM under the a), b) or c) perturbation, then the frame of the yellow (for a), light blue (for b) or purple (for c) box, is colored red or green, respectively.

