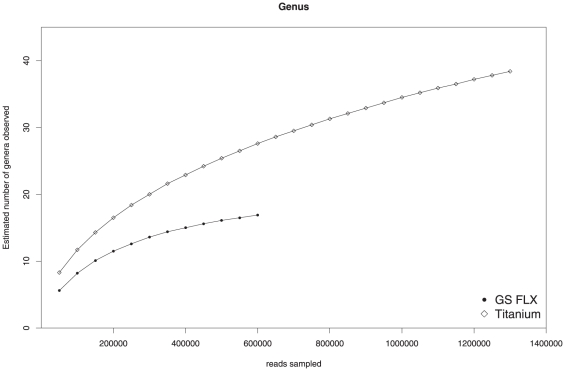
Figure 7. Rarefaction analysis of observed genera.
The rarefaction curves represent the estimated number of genera that would be observed in biogas fermenter metagenomes of different sizes. The values were determined based on 16S rRNA fragments classified at rank genus identified in the entire Titanium and GS FLX datasets, respectively.

