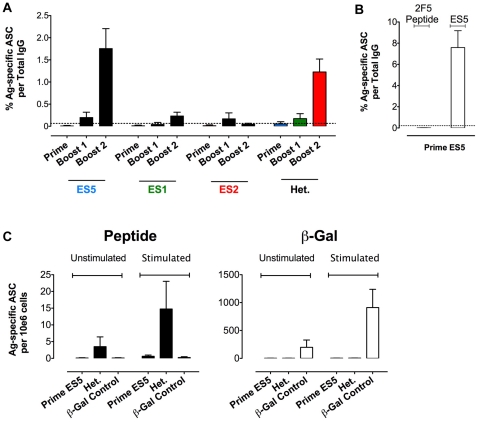
Figure 6. B cell ELISpots measuring epitope-specific or antigen-specific cells.
(A) 2F5 peptide-specific B cell responses induced by a homologous or a heterologous regimen after each immunization. Bars represent the mean and SEM values corresponding to measurements of five mice. Colored bars represent B cell responses from the heterologous prime∶boost immunization regimen and are color-coded to indicate the immunogen inoculated prior to collection of the B cells. As a negative control we measured anti-β-Gal protein responses, which are depicted in this graph as an average of responses of all animals participating in this analysis after 3 inoculations and is plotted as the horizontal dotted line across the bars. (B) B cell ELISpot measuring peptide, anti-ES5 responses in the one-time inoculated ES5 control mice after 34 days, the length of the entire regimen. (C) 2F5 peptide-specific (left) and protein control β-Gal (right) memory B cell responses after 6 days in vitro culture in the presence (stimulated) or absence (unstimulated) of LPS stimulation. Similarly, we compare the heterologous regimen (ES5-ES1-ES2) to the one inoculation ES5 control to show that the 2F5 peptide specific memory B cells in the LPS stimulated experiment were generated via an effective cross-priming heterologous ES boost.

