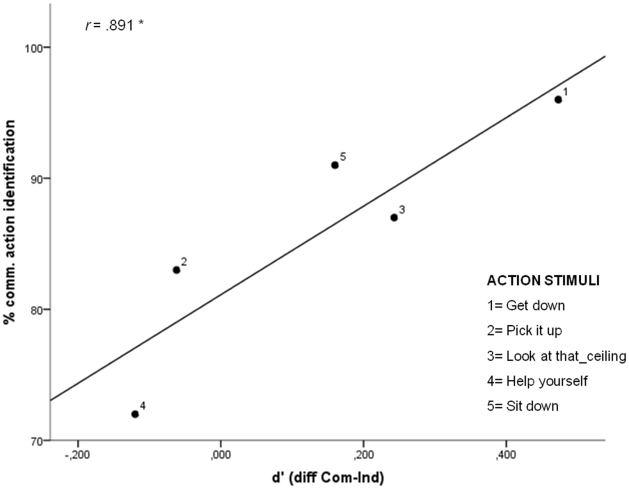
Figure 3. Scatter plot showing the correlation between communicative action identification and d'.
Identification scores are plotted on the ordinate, and represent the percentage of participants who correctly identified A's communicative actions (normative data [12]). The difference between communicative condition and individual condition is plotted on the abscissa (d'). The black line represents the linear regression line fitted to the data.

