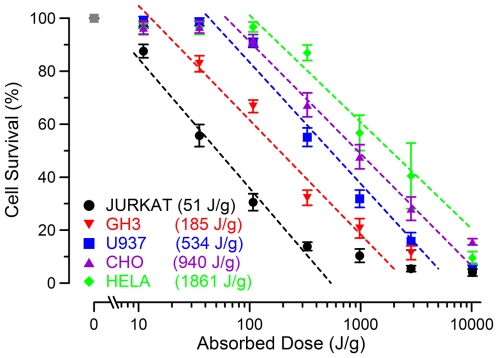
Figure 2. Cell survival as determined by dose in several cell types.
Mean survival values (+/− s.e., in % relative to sham-exposed control, n = 3–5) are plotted against the dose delivered to the cuvette. Logarithmic fit lines (dashed) reveal significant differences between cell populations. LD50 values (J/g) are displayed in the legend for each population as calculated using the logarithmic fit.

