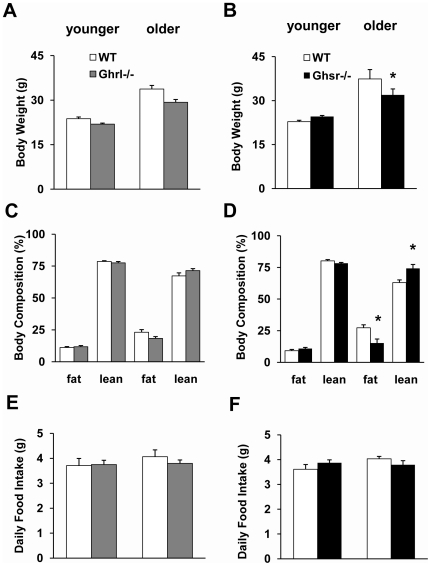
Figure 1. Body weight, body composition and daily food intake of WT, Ghrl-/-, and Ghsr-/- mice.
The data of Ghrelin-null mice are on the left (A, C, E), and the data for GHS-R-null mice are on the right (B, D, F). (A and B): Both younger and older Ghrl-/- mice had similar body weight compared to WT mice, while older Ghsr-/- mice had significantly lower body weight than WT mice. (C and D): The body composition of Ghrl-/- mice did not differ from age-matched WT mice, while older Ghsr-/- mice showed decreased proportions of body fat and increased proportions of lean mass. (E and F): The daily food intake of both null mice was comparable to that of their WT controls. The values are presented as mean ± SEM (n = 6–8 per group); *, P<0.05, null vs. WT mice.

