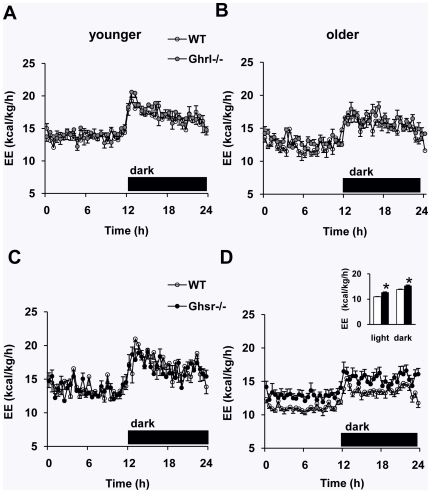
Figure 2. Representative energy expenditure (EE) profiles of WT, Ghrl-/- and Ghsr-/- mice.
The data for Ghrelin-null mice are on the top (A, B), and the data for GHS-R null mice are on the bottom (C, D). (A and B): The energy expenditure of neither younger nor older Ghrl-/- mice differed from their WT control mice. (C and D): Older Ghsr-/- mice had a higher energy expenditure when compared with WT mice, whereas there was no difference in younger mice. The values are presented as mean ± SEM (n = 6–8 per group). *, P<0.05, null vs. WT mice.

