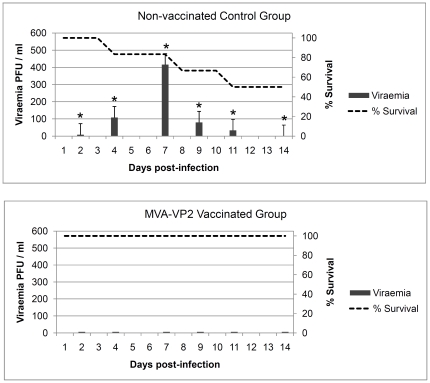
Figure 4. Protection of MVA-VP2 vaccinated IFNAR −/− mice against AHSV-4 challenge.
Non-vaccinated control and MVA-VP2 vaccinated mice were challenged with AHSV-4. Survival rates (dotted lines) and viraemia titres (grey histograms) of both groups were compared. Each histogram represents the mean values of the viral titer of six animals, and standard deviations are shown as error bars. Asterisks indicate statistical significance calculated using the Student's t test (p<0.05).

