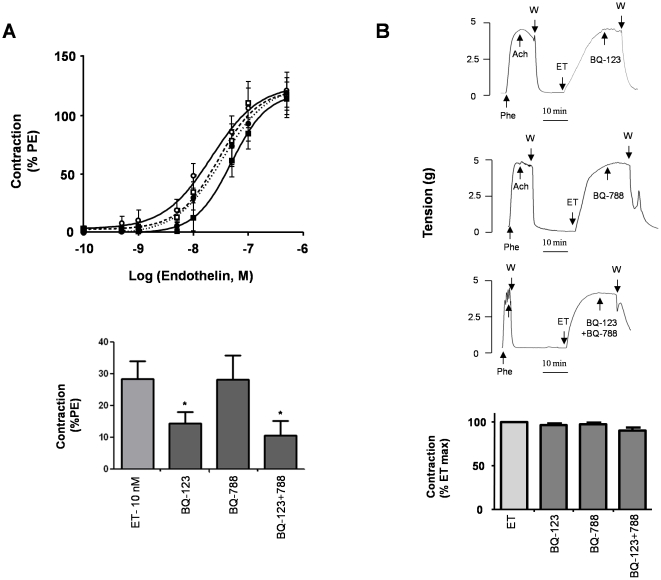
Figure 1. Contractile response of the human uterine artery to ET-1 and effect of ET receptor antagonists.
(A) Upper panel: Dose-response curves obtained by cumulative increases in the concentration of ET-1 (0.1 nM–0.1 µM) on basal tone (CTL,❍), after pre-incubation for 10 minutes with either an ETA receptor antagonist (BQ-123, 1 µM,•) or an ETB receptor antagonist (BQ-788, 1 µM,☐), or a mixture of both antagonists (BQ-123+788, 1 µM,▪). Lower panel: Average contraction of uterine artery induced by 10 nM ET-1 with or without a 10 minutes pre-incubation period with either BQ-123, BQ-788 or BQ123+788 each at 1 µM concentration. Data are expressed as a percentage of the contraction induced by Phe (10 µM). (B) Effects of ET receptor antagonists when arteries were contracted with ET-1 (0.1 µM). When maximal contraction was established, ET receptor antagonists were added at the same concentrations used in panel A as illustrated on typical recordings of variations of isometric tension (upper panels). Bar graph represents the average tension after the addition of the drugs, expressed as a percentage of the contraction induced by ET-1 (lower panel). In all experiments, values indicate the means ± S.E.M. of 10 different arteries with experiments performed in triplicate.

