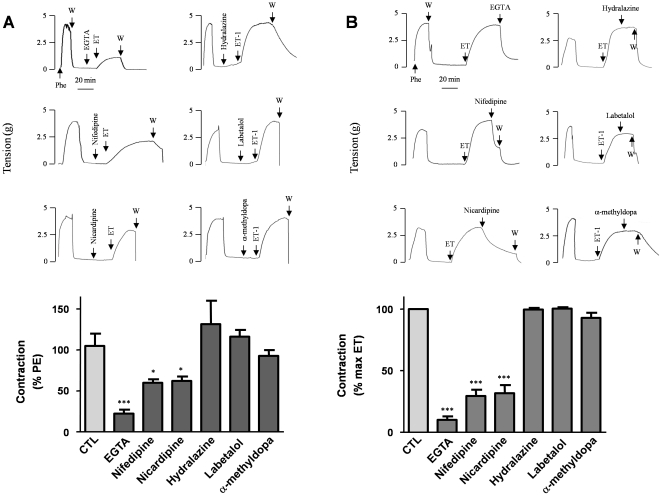
Figure 3. Antagonism of the contraction induced by ET-1.
Upper panels represent typical recordings of isometric tension for each condition. Lower panels are bar graph representations of the respective data. (A) A 10-minute pre-incubation was carried out before contraction was elicited by ET-1 (0.1 µM), with either EGTA (10 mM), nifedipine or nicardipine (1 µM), or hydralazine, labetalol or alpha-methyldopa (100 µM). Data are expressed as a percentage of the contraction induced by Phe and represent the maximal tension reached with ET-1 in the presence of the drugs. (B) The artery was contracted with ET-1 (0.1 µM); derivatives were added when the steady state was established. Data represent the residual tension after the addition of drugs and are expressed as a percentage of the maximal contraction induced by ET-1. Values indicate the means ± S.E.M. of 10 different arteries, with experiments performed in triplicate. *p<0.01, ***p<0.0001.

