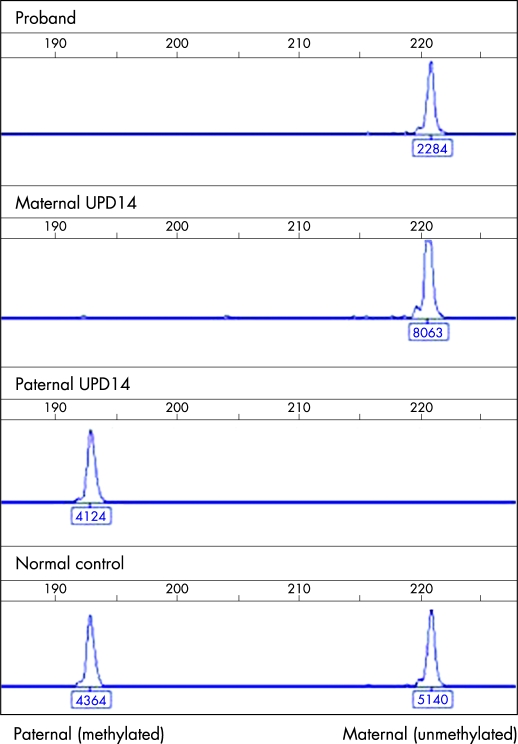
Figure 2.
Electropherograms of methylation specific PCR of the DLK1/GTL2 intergenic DMR. The x axis represents product size (in bp), and the y axis the peak height (fluorescence units), as do the figures under each peak. The maternal, unmethylated product is 221 bp; the paternal, methylated product is 193 bp. Trace 1, proband; trace 2, maternal uniparental disomy (UPD) control; trace 3, paternal UPD control; trace 4, normal control.

