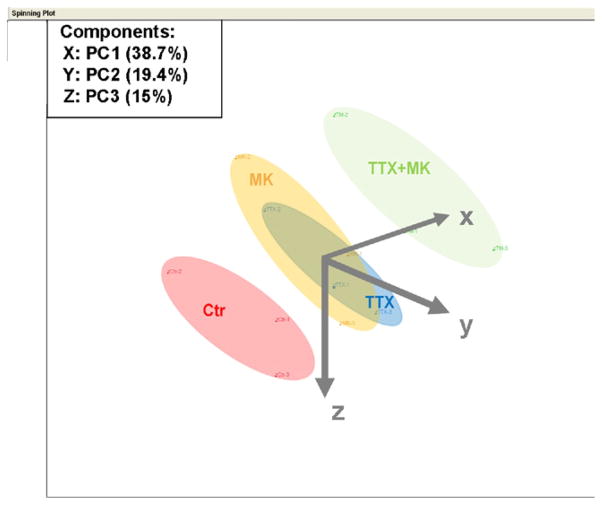
Fig. 2.
Silencing of intrinsic neuronal activity and glutamatergic synaptic transmission results in similar changes in gene expression compared with electrically active control neurons. Results of a principle component analysis displayed as 3-dimensional diagram along 3 axes. Each point represents the specific gene expression profile in this space for 3 replicates of neurons in control conditions (Ctr), tetrodotoxin treatment (TTX), MK-801 treatment (MK), or combined TTX and MK-801 treatment (TTX+MK). The expression profile of control neurons locates in a cluster that is distinct from all other conditions. TTX and MK-801 treatment cause gene expression profiles that are highly similar and locate in overlapping clusters. Combined treatment with TTX and MK-801 results in a distinct gene expression profile cluster that is more distant from control neurons than TTX or MK-801 treatment alone.

