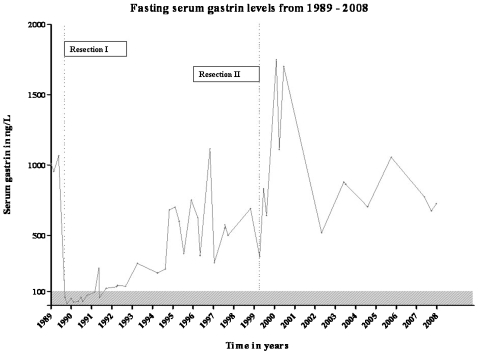
Figure 1.
Fasting serum gastrin levels (ng/litre), measured on multiple occasions during the evaluation from 1989 until 2008, are presented. The grey region represents the area in which serum gastrin is within normal limits (<100 ng/litre). Dotted lines indicate the first and second partial liver resections in 1990 and 1999, respectively.

