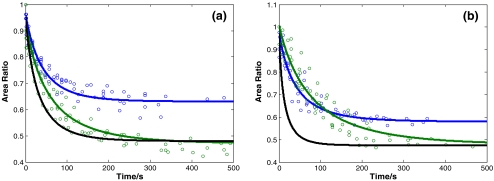
Fig. 10.
Recovery curves measured for cells untreated or treated with cytochalasin D. (a) 3T3 cells: untreated, reference conditions (black), treated with CytoD, A0/Amax = 0.5 (green, N = 6,%RSD = 4.8), treated with CytoD, A0/Amax = 0.7 (blue, N = 5,%RSD = 3.0). (b) HL60 cells: untreated, reference conditions (black), treated with CytoD, A0/Amax = 0.5 (green, N = 6,%RSD = 4.8), treated with CytoD, A0/Amax = 0.6 (blue, N = 6,%RSD = 3.9). N is the number of cells tested for each condition. Each marker represents one data point; the data points of multiple cells are shown. The lines represent fits according to Eq. 7

