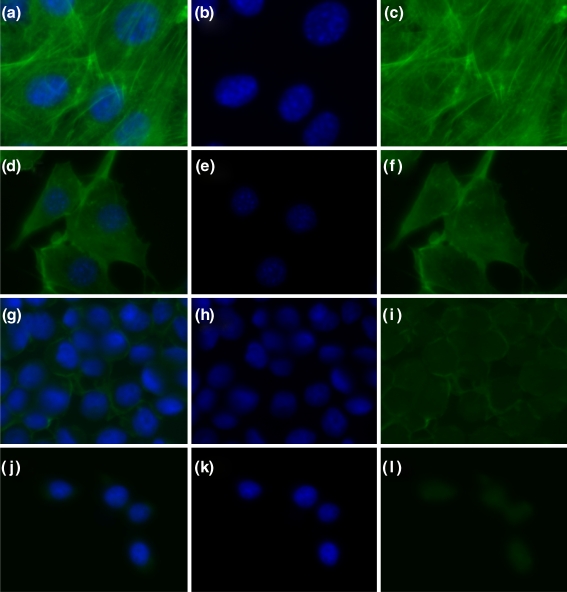
Fig. 4.
Fluorescence images of 3T3 (a–c), CytoD treated 3T3 (d–f), HL60 (g–i), CytoD treated HL60 (j–l) stained with phalloidin (green, showing actin) and DAPI (blue, showing nuclei). The first column visualizes both the actin (green) and the nuclei (blue), whereas the second and third columns show respectively the nuclei and the actin only

