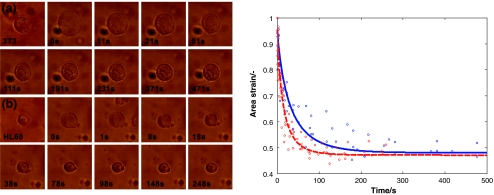
Fig. 6.
Left, images of the recovery of the cells at various points in time, after sudden release of the pressure at t = 0. (a) 3T3; (b) HL60. Right, the recovery curves of 3T3 (solid blue), and HL60 (dashed red), showing the change in time of the area ratio defined in Eq. 4. In these measurements, the reference measurement conditions were used. Each marker represents one data point; the data points of multiple cells are shown. The lines represent fits according to Eq. 7

