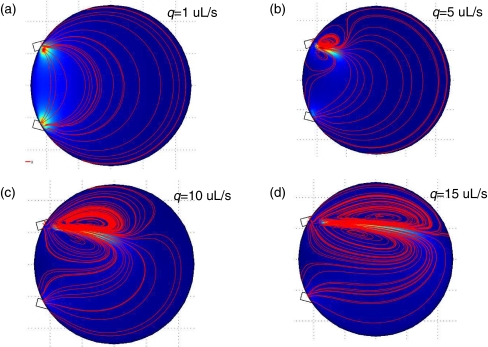
Fig. 9.
Flow patterns for the baseline case where α = 45, β = 60 with varying inlet flow rates. The blue color represents low fluid velocity magnitude, while the orange color represents high fluid velocity magnitude. Streamlines of the fluid are indicated in red. (a) q = 1 uL/s, (b) q = 5 uL/s, (c) q = 10 uL/s, (d) q = 15 uL/s

