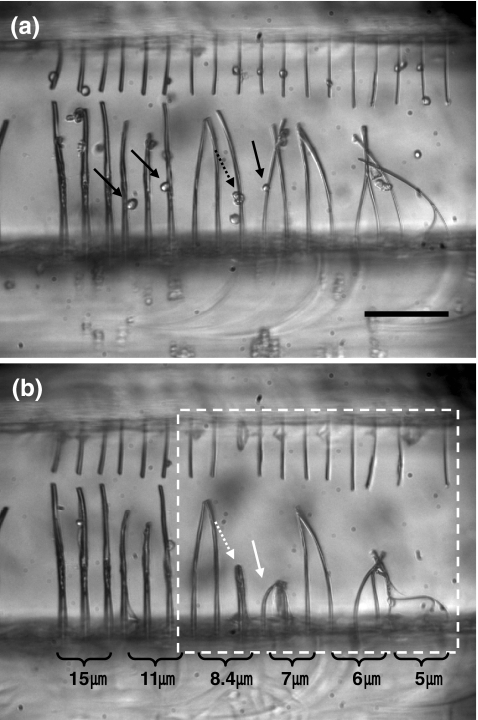
Fig. 5.
Microscope images of fiber scaffolds right after cell loading (a) and 350 min after cell loading (b). Black-line arrows indicate cells right before cell adhesion, and white-line arrows indicate cells on buckled fibers. Solid-line arrows indicate single cells, and dashed-line arrows indicate multiple cells. The dashed-line box in (b) highlights buckled fibers. Scale bars: 200 μm

